A senior manager resigns on a Tuesday. By Friday you find out that four people now report to nobody, and that the person who used to sit between them and the rest of the company was the only one who knew how their work got prioritised.
Nobody planned that. It was also visible in the org chart the whole time.
That is the useful thing about key person risk: some of it is structural, and structural risk is legible. You do not need a succession planning project to find it. You need the roster you already have and about ten minutes.
If you have read the healthy span of control thresholds, this is the same engine looked at from a different angle.
The three shapes your chart already names
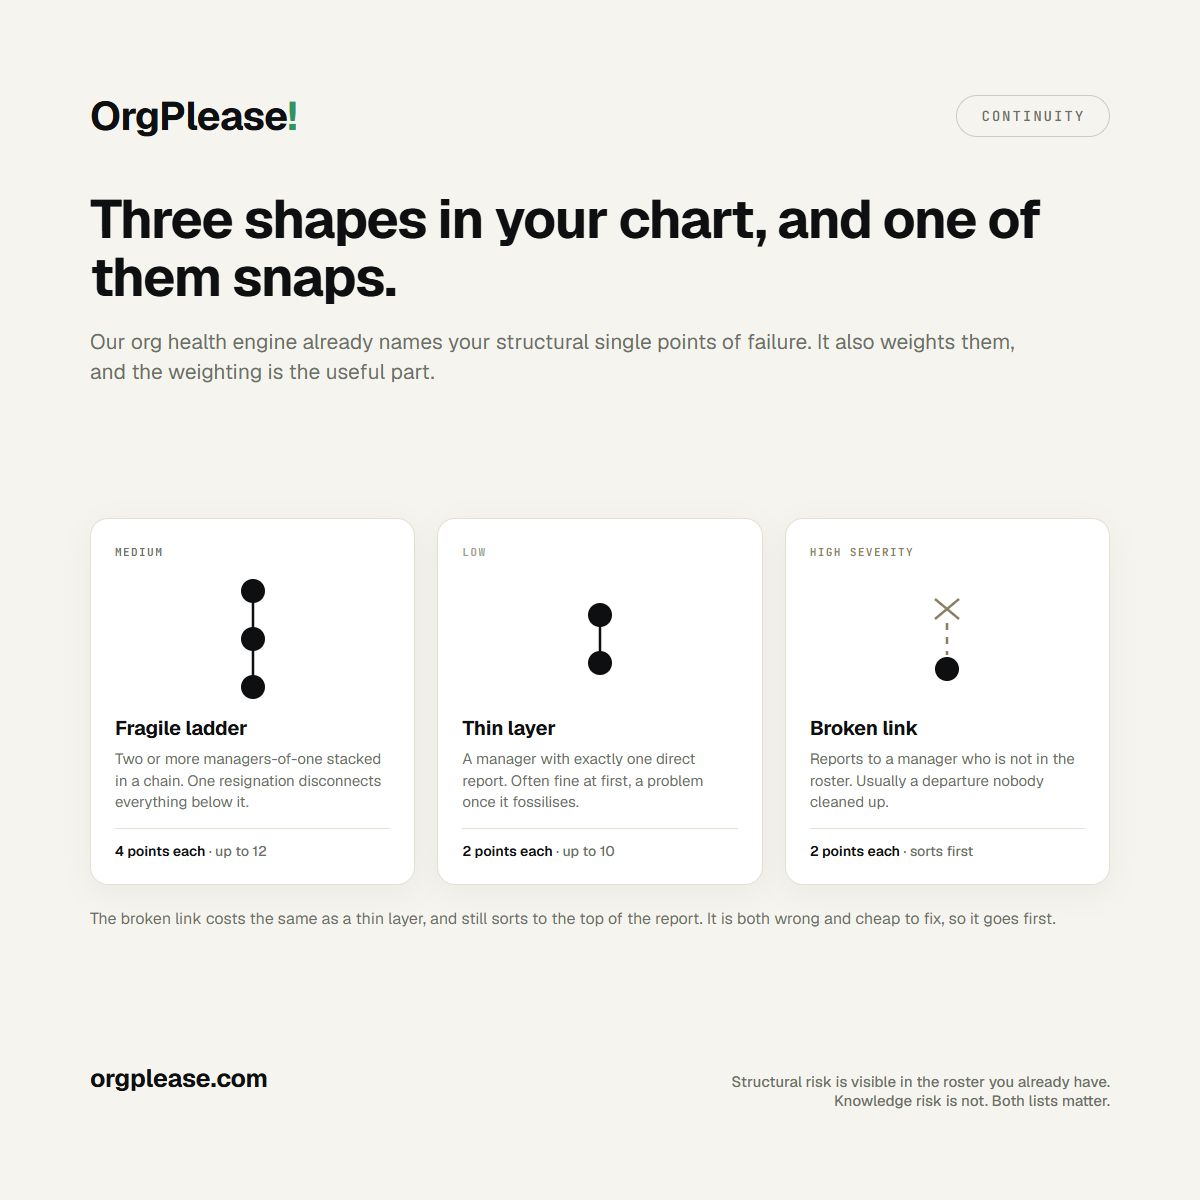
Our org health engine scores any uploaded chart and lists what it found. Three of its findings are structural single points of failure. Each one describes a place where one departure does more damage than the headcount suggests.
The fragile ladder. Two or more managers-of-one stacked in a chain: A manages only B, B manages only C. Every link adds a hop and none of them adds capacity. Pull any one person out and the run snaps, because there is no peer at that level to absorb the reports. This is the shape people are usually describing when they say someone is load-bearing.
The thin layer. A single manager with exactly one direct report. On its own this is often benign, and sometimes deliberate: a new manager learning with one person, or a genuine apprenticeship. It turns into risk when it fossilises, when the manager-of-one is still a manager-of-one two years later and the reporting line exists mostly because a reorg left it there.
The broken reporting link. Someone in the roster reports to a manager who is not in the roster. In a clean export this is a data error. In practice it is usually a departure nobody cleaned up: the manager left, the file still points at them, and the people underneath have been quietly unmanaged since.
Which key person risk should worry you most
The engine has an opinion here, and the opinion is more useful than the list.
A fragile ladder costs 4 points off the health score for each chain it finds, up to 12. A thin layer costs 2 points each, up to 10. That two-to-one difference is deliberate. One manager-of-one is a question worth asking. A chain of them is a corridor where a single resignation disconnects everything below it.
The broken reporting link is rated differently again. Its score penalty is 2 each, the same as a thin layer, so it will not wreck your grade. Its severity is set to high, which pushes it to the top of the findings list ahead of everything else. That is on purpose. A broken link is both wrong and cheap to fix, and until you fix it your chart is lying to you about who reports to whom.
So the order to work in is: repair the broken links first because they take minutes, then the fragile ladders because they carry the real structural exposure, then the thin layers as a slower question about whether that role still earns a reporting line.
What the chart cannot see
Here is the limit, stated plainly. An org chart shows reporting concentration. It does not show knowledge concentration.
The chart can tell you that four people would be left without a manager. It cannot tell you that only one person understands why the invoicing job runs at 2am, and that person is an individual contributor three levels down who appears nowhere in any of the findings above. Structural risk and knowledge risk overlap, and they are separate lists. Run the structural audit because it is fast and objective, then have the harder conversation about what lives in one person's head.
The ten-minute audit
You can find all three shapes with the two columns every roster already has: each person's email, and their manager's email. Call them column B and column C.
Count direct reports. In a spare column, run =COUNTIF(C:C, B2) and fill it down. That counts how many people name this person as their manager. Anyone with a result of 1 is a thin layer.
Find the chains. Take your list of managers-of-one and check whether any of them reports to another manager-of-one. Sorting by column C groups each manager's reports together and makes the runs easy to spot. Two in a row is a fragile ladder. Three in a row deserves a conversation this week.
Find the broken links. Run =COUNTIF(B:B, C2)=0 down the roster. Any TRUE means that person's manager does not exist anywhere in your employee list. Those are your broken reporting links, and they are usually the fastest thing on this page to fix.
Ten minutes of counting will not tell you everything. It will tell you whether you have a corridor problem, and it gives you names to check instead of a feeling.
If I could only fix one of the three, I would take the fragile ladders. A thin layer and a broken link are both cheap to reverse next quarter. A chain that snapped in the middle is not.
What actually reduces the risk
Finding a fragile ladder is a different job from fixing one, and the fix is usually structural rather than a hiring decision.
Collapse the ladder. Remove the intermediate reporting line and let the reports move up one level. This is the direct fix and it widens the span above, which is a trade worth making deliberately rather than by accident. The layer decision post covers what widening costs and when it stops being the right answer.
Give the manager-of-one a second report, or move them back to individual contribution. Both resolve a thin layer. The second option is the one teams avoid, and it is often correct when the title outlasted the team it was created for.
Re-point the orphans. Assign a real manager in the roster and re-upload. Nothing structural changes; your chart just stops being wrong.
Worth noticing where these shapes come from. Most fragile ladders were never designed. They accumulated, one reasonable-looking promotion at a time, and this is the bill for those layers arriving later than the decision did.
If you would rather see it than count it, OrgPlease! runs this analysis on every chart automatically and names the findings using the same weights you just read. Upload a roster and the health report scores the structure out of 100 in about a minute. It is free up to 25 people. Modelling a fix before you commit to it is scenario planning, which is on the paid plans. (The chart reflects your last roster upload plus any edits you make in the app.)
Bottom line
Key person risk is partly a knowledge problem, which is slow to audit and mostly lives in conversations. It is also partly a shape problem, and the shape is sitting in a spreadsheet you already own.
Start with the shape. Repair the broken reporting links today, walk the fragile ladders this month, and treat every manager-of-one as a question rather than a finding. Then go and ask who knows how the invoicing job works.
See your own structure scored. Upload your roster and get a health report in about 60 seconds, with fragile ladders, thin layers, and broken links named. Free up to 25 people; scenario planning is on the paid plans. Start your free org chart
Related reading: Lire cet article en français · What's a healthy span of control? · When to add a management layer · How to plan a reorg without breaking the org you have